![]() Risk Graph vs LOPA — SIL Determination Made Simple
Risk Graph vs LOPA — SIL Determination Made Simple
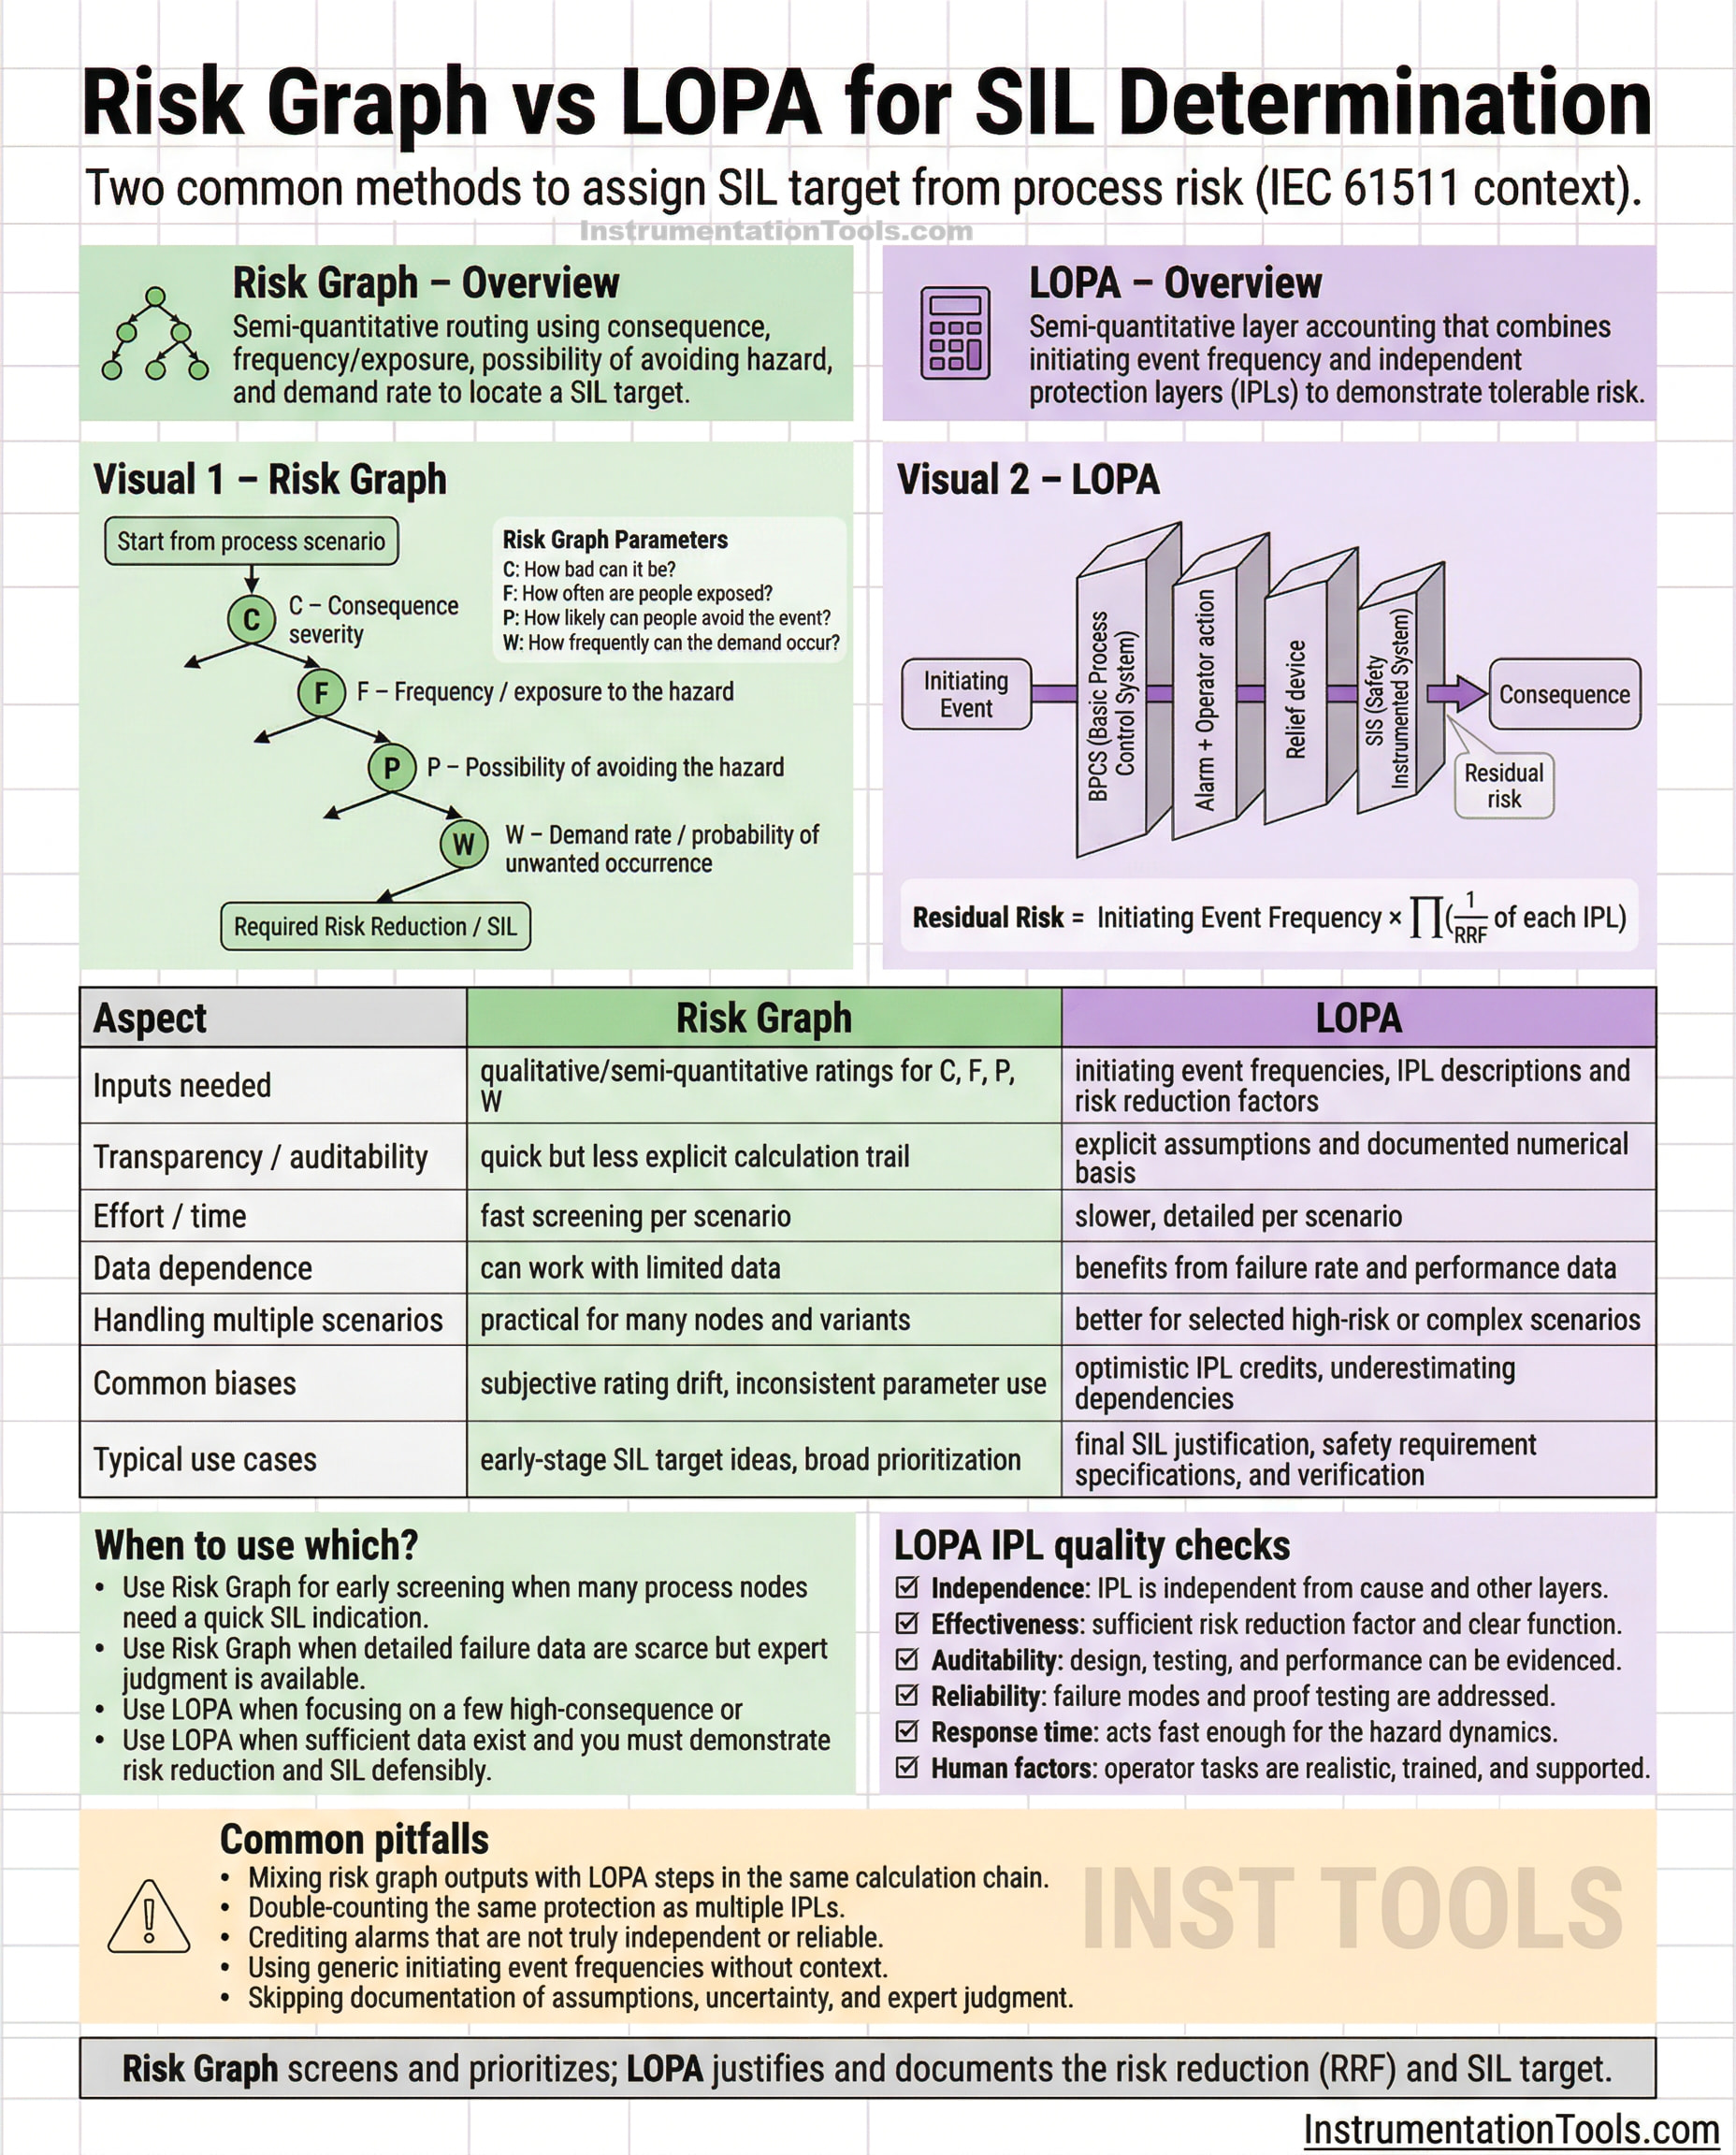
When deciding SIL levels, engineers often ask:
![]() Risk Graph or LOPA… which one to use?
Risk Graph or LOPA… which one to use?
Here’s a clear comparison ![]()
 Risk Graph Method
![]() Qualitative approach
Qualitative approach
![]() Uses parameters like:
Uses parameters like:
![]() Severity (S)
Severity (S)
![]() Frequency (F)
Frequency (F)
![]() Probability (P)
Probability (P)
![]() Avoidance (A)
Avoidance (A)
![]() Based on answers, SIL is selected from a graph/chart
Based on answers, SIL is selected from a graph/chart
 Why Risk Graph is used
![]() Quick and simple
Quick and simple
![]() Less data required
Less data required
![]() Useful in early project stages
Useful in early project stages
![]() Depends heavily on engineering judgment
Depends heavily on engineering judgment
LOPA (Layers of Protection Analysis)
![]() Semi-quantitative method
Semi-quantitative method
![]() Uses numerical values for:
Uses numerical values for:
![]() Event frequency
Event frequency
![]() Protection layer effectiveness
Protection layer effectiveness
![]() Risk reduction
Risk reduction
![]() Calculates required SIL more accurately
Calculates required SIL more accurately
![]() Why LOPA is used
Why LOPA is used
![]() More detailed and reliable
More detailed and reliable
![]() Based on actual data
Based on actual data
![]() Widely used in real projects
Widely used in real projects
![]() Key Differences
Key Differences
![]() Risk Graph → Qualitative
Risk Graph → Qualitative
![]() LOPA → Semi-quantitative
LOPA → Semi-quantitative
![]() Risk Graph → Faster
Risk Graph → Faster
![]() LOPA → More accurate
LOPA → More accurate
![]() Risk Graph → Early design stage
Risk Graph → Early design stage
![]() LOPA → Detailed design stage
LOPA → Detailed design stage
![]() Practical approach
Practical approach
![]() Risk Graph → Initial SIL estimation
Risk Graph → Initial SIL estimation
![]() LOPA → Final SIL confirmation
LOPA → Final SIL confirmation
![]() Key takeaway
Key takeaway
![]() Use Risk Graph for quick screening
Use Risk Graph for quick screening
![]() Use LOPA for final decision
Use LOPA for final decision
![]() Both aim to reduce risk to acceptable level
Both aim to reduce risk to acceptable level
![]() Simple understanding
Simple understanding
![]() Risk Graph = Quick judgment
Risk Graph = Quick judgment
![]() LOPA = Calculated decision
LOPA = Calculated decision
![]()
![]() WATCH VIDEO:
WATCH VIDEO:

#FunctionalSafety #SIL #LOPA #ProcessSafety #Instrumentation Automation #ControlSystems #Engineering #IEC61511 #SafetyEngineering ![]()